Solana Eases Gains: Can SOL Bulls Safeguard the $132 Support?
Solana started a fresh decline from the $155 resistance. SOL price is down over 10%, but the bulls are now protecting the $132 support.
SOL price started a strong decline from the $155 resistance against the US Dollar.
The price is now trading below $145 and the 100-hourly simple moving average.
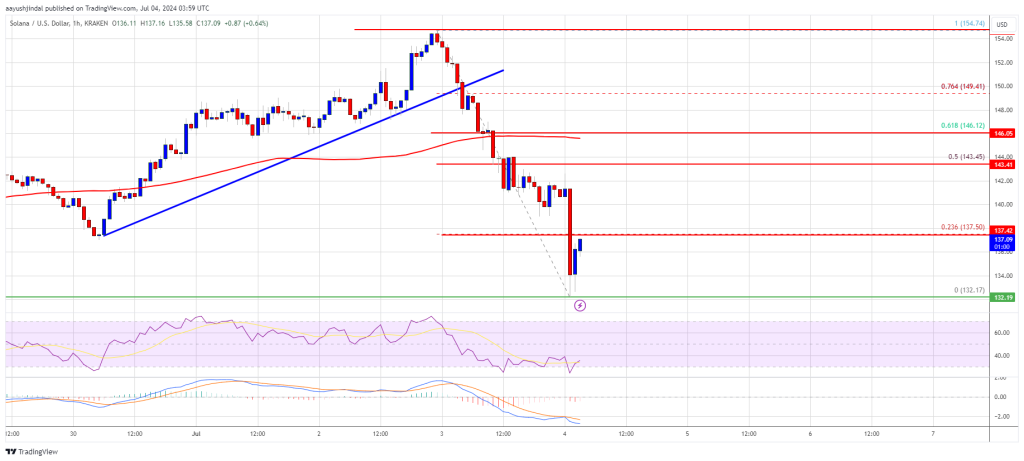
There was a break below a connecting bullish trend line with support at $150 on the hourly chart of the SOL/USD pair (data source from Kraken).
The pair could correct losses unless the bulls struggle to protect the $132 support.
Solana Price Dives 10%
Solana price struggled to continue higher above the $155 resistance. SOL reacted to the downside and declined below the $150 support. There was a break below a connecting bullish trend line with support at $150 on the hourly chart of the SOL/USD pair.
The pair gained bearish momentum below the $145 support and declined more than outperformed Bitcoin and Ethereum in the past two sessions. There was a drop toward the $132 support zone. A low was formed at $132.17 and the price is now attempting a recovery wave.
There was a move above the $135 level. The price is now approaching the 23.6% Fib retracement level of the recent decline from the $154.74 swing high to the $132.17 low.
Solana is now trading well below the $145 level and the 100-hourly simple moving average. If there is another increase, the price might face resistance near the $138 level. The next major resistance is near the $143.50 level and the 50% Fib retracement level of the recent decline from the $154.74 swing high to the $132.17 low.
A successful close above the $143.50 resistance could set the pace for another steady increase. The next key resistance is near $150. Any more gains might send the price toward the $155 level.
More Losses in SOL?
If SOL fails to rise above the $143.50 resistance, it could start another decline. Initial support on the downside is near the $135 level.
The first major support is near the $132 level, below which the price could test $125. If there is a close below the $125 support, the price could decline toward the $112 support in the near term.
Technical Indicators
Hourly MACD – The MACD for SOL/USD is gaining pace in the bearish zone.
Hourly Hours RSI (Relative Strength Index) – The RSI for SOL/USD is below the 50 level.
Major Support Levels – $135, and $132.
Major Resistance Levels – $143.50 and $150.
Welcome to Billionaire Club Co LLC, your gateway to a brand-new social media experience! Sign up today and dive into over 10,000 fresh daily articles and videos curated just for your enjoyment. Enjoy the ad free experience, unlimited content interactions, and get that coveted blue check verification—all for just $1 a month!
Account Frozen
Your account is frozen. You can still view content but cannot interact with it.
Please go to your settings to update your account status.
Open Profile Settings